2019年中考英语阅读理解专项训练及答案:Understanding Graphics
 点击免费领取中考核心考点资料!
Understanding Graphics(图表)
When we are reading, we often see one or two graphics in a text. Have you ever thought about these questions: Why are they there? What information do they give? Do they help with our reading and understanding?
Graphics are things like pictures, maps, charts and tables. They give information to readers. Very often, we can see different kinds of graphics in books, magazines and newspapers. Writers use graphics to get the readers’ attention and give them some particular(特别的) information. Graphics help to understand the given information in a text. And graphics put the information in a particular order so that it’s easy to understand when we take a quick look.
It is not always true that a picture is worth a thousand words. But many things are easier to show than to tell and they may also be easier to understand. Graphics are just the right things that give a great deal of information but it doesn’t take much time to read and understand.
The right way to read and understand a graphic is to look at the picture and the words together. In a graphic, only a few words are used to explain what the picture shows you. Sometimes, numbers and percentages(百分比) are also given to go with the words to explain things.
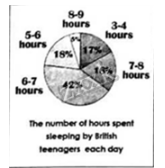
Now look at the graphic on the right. It is how a researcher used a graphic to show the number of hours spent sleeping by British teenagers each day. Can you understand it?


